


U-2012: An improved Lowry protein assay, insensitive to sample color, offering reagent stability and enhanced sensitivity
Abstract
Traditional colorimetric protein assays such as Biuret, Lowry, and modified Lowry (U-1988) are unsuitable for colored biological samples. Here we describe an improved Lowry protein assay (U-2012), which utilizes stable reagents and offers enhanced sensitivity over the U-1988 assay. U-2012 circumvents interference from colored pigments and other substances (for example sugars) bound to perchloric acid (PCA) precipitated proteins by hydrogen peroxide (H2O2) induced oxidation at 50°C. Unused hydrogen peroxide is neutralized with sodium pyruvate before protein estimation for a stable end color. The U-2012 assay is carried out on the PCA precipitated protein pellet after neutralization (with Na2CO3 plus NaOH), solubilization (in Triton-NaCl), decolorization (by H2O2) and pyruvate treatment. Protein contents in red wine and homogenates of beetroot and blueberry are calculated from standard curves established for various proteins and generated using a rectangular hyperbola with parameters estimated with Microsoft Excel's Solver add-in. The U-2012 protein assay represents an improvement over U-1988 and gives a more accurate estimation of protein content.
Quantitative measures of physiological traits such as enzyme activity are often expressed as units of activity per milligram protein. Although numerous assays have been developed to measure protein content, including the colorimetric assays of Amido Black (1), Biuret (2), Bicinchoninic Acid (3) and Coomassie Blue (4,5), the Lowry assay (6) or its modifications (7,8) are more commonly used than other assays (9). The Lowry assay is simple, sensitive and precise, and is the most cited (10) procedure for quantitative protein determination.
A wide variety of compounds that react with Folin-Ciocalteu phenol (Folin's) reagent (11) are a source of potential interference in Lowry and modified Lowry protein assays. Fortunately, corrections through an appropriate blank is sufficient for most compounds (6,7) except lipids (12), detergents (13) and colored substances (14). Difficulties in assaying proteins in presence of lipids and detergents (used in the solubilization of adipose tissue, myelin and skeletal muscles) were overcome by the modified Lowry assay (15; referred to in this paper as the U-1988 assay, 16). Color interference in determining the protein content in red wine (14,17,18) was overcome by employing extensive chromatography. The above approach is cumbersome and not very practical for handling large numbers of samples. None of the known protein assays were suitable for measuring proteins in colored biological samples e.g., colored fruits and vegetables, red wine, pigmented microbes and ruminant bile.
Our development of the U-2012 assay from its predecessors the U-1988 and the Lowry assay has achieved three major advantages (i) convenience through stability of the reagent formulations, (ii) measurement of protein in both colorless and colored biological samples without compromising the sensitivity, and (iii) assaying proteins at very low concentrations. This novel assay will be applicable to quantitative determination of protein in both colorless and colored biological sample homogenates, including those rich in lipids (e.g., avocado) and those difficult to homogenize.
Materials and methods
Biological samples – beetroot, blueberry and red wine
Beetroot and blueberry homogenates were prepared as described in the Supplementary Material. Red wine did not require protein extraction prior to the U-2012 assay.
Chemical reagents
All chemical reagents, except sodium hypochlorite and perchloric acid (PCA), were obtained from Sigma or Sigma-Aldrich (St Louis, MO. USA). Sodium hypochlorite was from Acros Organic, New Jersey, USA. PCA was obtained from BDH (England).
Improvements to U-1988 assay
Switching from carbonate to phosphate buffer at pH 12.0 improved reagent stability and gave a small increase in sensitivity. Acetonitrile was introduced to avoid detergent-induced bubbles. NaOH replaced KOH to avoid precipitation in the protein assay. In addition, efficiency was enhanced by combining various components of the Lowry reagent into one reagent mix.
The U-2012 assay
Full details of the U-2012 assay are provided in Supplementary Material. The protocol, briefly summarized in Figure 1, describes the processing of red wine and the homogenates of beetroot and blueberry, and includes the improvements to the U-1988 assay. The U-2012 assay was employed for unprocessed, processed [treated with either trichloroacetic acid (TCA) or PCA followed by hydrogen peroxide (H2O2)] and reverse processed (H2O2 treatment followed by TCA or PCA precipitation) proteins. Assays were carried out on BSA, carbonic anhydrase, cytochrome C, isocitrate dehydrogenase, lysozyme and trypsin for the development of standard curves and in colored biological samples. The determination of proteins in the biological samples was carried out by calibrating to appropriate standard curves.
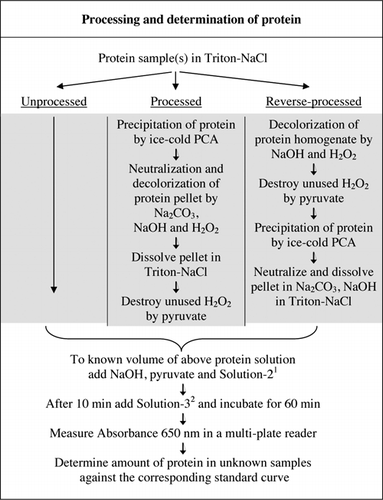
1Solution-2 contained copper sulfate (CuSO4.5H2O), Na-K-Tartrate, SDS and acetonitrile in 100 mM phosphate buffer (pH 12.0). 2For Solution-3, Folin-Ciocalteu's phenol reagent was diluted 1:1 with deionized water just before use.
Estimation of color interferences in the U-2012 assay
Color interference was determined by comparing absorbency from processed and unprocessed beetroot, blueberry and red wine samples both with and without the use of Folin's reagent as described in Figure 1. The ratio [(Abs1 – Abs2) / (Abs3 – Abs4)] was used to establish the extent of interference, where Abs1 is absorbance of unprocessed samples with Folin's reagent; Abs2 is absorbance of unprocessed samples without Folin's reagent; Abs3 is absorbance of processed samples with Folin's reagent; and Abs4 is absorbance of processed samples without Folin's reagent.
The standard curve and its parameters
Solution-1B and 1C described in the Recipes section of the attached Supplementary Material were used for the development of the standard curves. The concentration of BSA and the corresponding absorbance values were plotted using an X-Y scatter graph. The form of this graph (Figure 2) shows a saturating response at higher concentrations with a very limited initial linear response. This was a preferred curve form reported previously (20). Initially this was modeled using an exponential form (19) but later studies showed that a rectangular hyperbola gave an improved alignment with the response, particularly at lower concentrations. This latter form has now been standardized and the following three-parameter equation was used to describe the absorbance-protein concentration relationship: 
Conc = Protein concentration,
A = Absorbance at Conc,
A0 = Absorbance at zero concentration,
AM= Absorbance at max concentration,
C50= Concentration giving absorbance
(AM + A0)/2.
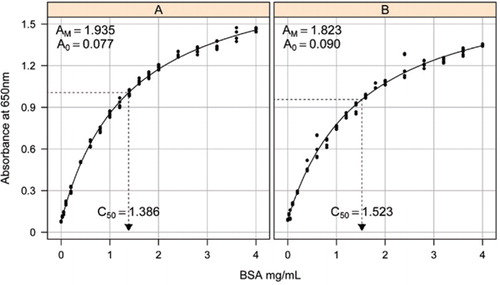
Estimation of the standard curve between the absorbance (650 nm) and concentrations of BSA protein was made on three technical replicates to (A) the unprocessed protein assay (parameters A0= 0.077, Am=1.935, C50=1.386), and (B) the processed protein assay (parameters A0=0.90, Am=1.823, C50=1.523). A rectangular hyperbola model (equation [1]) was fitted to the observed data. Parameter estimates are identified in the curves with the C50 estimation on the x-axis (dotted black line).
Parameter A0 was experimentally determined while AM and C50 were estimated using Microsoft Excel's Toolbox add-in Solver Function. A trial set of parameters was used to calculate the modeled absorbance at each of the standard concentrations (Conc) using equation [1]. Solver was then commanded to minimize the residual standard deviation between the measured and modeled absorbance for the standard set by adjusting AM and C50.
We observed the relationship between absorbance and concentration to exhibit a non linear curve over the entire concentration range, which is likely to be due to a component of light scattering which increases as the concentration of protein increases when measuring absorbance. A poor linear fit at low absorbance was also reported by Coakley and James (20).
Calculation of protein content in the homogenates
Assays were carried out on processed and unprocessed red wine and homogenates of beetroot and blueberry. BSA and other protein samples were treated identically for appropriate standard curves to determine A0, AM and C50 values. These parameters were then used to convert sample absorbance (A) to protein concentration in each homogenate using:
Because the equation has a saturating form, the sensitivity reduces as absorbance (A), and hence concentration, increases. Errors in protein estimations may be minimized by adjusting the concentrations of homogenates in the assay so that they do not excessively exceed the C50 value.
The Homogenate Conc value was then converted to tissue protein concentration (Tissue Conc in mg/g of tissue) using the following formula:
where Homogenate Conc (in mg protein/mL) has been corrected for any pre-concentration or dilution during the assay. Homogenate percentage was 100 g of tissue homogenized to a total volume of 200 mL (in our case 50%).
In a separate study, a rectangular hyperbola model was fitted using the non linear mixed effects (NLME) package (21) in R (22) (Figure 2). Each BSA solution, made independently in the laboratory, was modeled as a random effect, with a common A0 but different AM and C50 coefficients. This models the hierarchy of biological sample replicates and technical assay replicates.
Results and discussion
Improvements in the U-1988 assay
The limitation of the U-1988 and the Lowry assay is the instability of the carbonate-based reagent. The carbonate buffer (pH 11.4 at 2% = 188.7 mM) in U-1988 was replaced with 40 mM phosphate at pH values ranging from 11.4 to 12.5. Initial slopes from the standard curves of the protein assay using BSA at 0.5 mg BSA/ mL and 1.0 mg BSA / mL were calculated. The initial slopes with phosphate buffers at pH 11.4 and at its optimal pH 12.0 were 99 x10-6 and 197 x10-6respectively. The slope for the carbonate buffer (pH 11.4) was 162 x10-6.Since the slope value is a direct indication of assay sensitivity, phosphate buffer (pH 12.0) was chosen to replace carbonate buffer, giving a 25% increase in sensitivity.
Greater stability was achieved by increasing concentration of the phosphate buffer to 100 mM. The resulting phosphate/CuSO4/Na-K-tartrate solution was stable at room temperature for two weeks, considerably longer than the carbonate/CuSO4/Na-K-tartrate solution, which must be prepared daily before protein assay. For all future experiments, 100 mM phosphate (pH 12.0) was used to prepare the CuSO4/Na-K-tartrate solution. We believe that replacement of carbonate with phosphate will enhance the convenience of the U-2012 assay.
Detergent induced bubbles become a major source of error in absorbance measurements when using a multi-well plate reader (not an issue with cuvettes). These bubbles were reduced considerably by the addition of a number of polar solvents (e.g., acetone, acetonitrile, ethanol and methanol). Acetonitrile, the most polar of these solvents (23) was chosen for its effectiveness and included in Solution-2 (see Figure 1 caption and Recipes section of Supplementary Material).
Phosphate buffer, CuSO4, Na-K-tartrate, SDS and acetonitrile can be added individually and the order of their addition does not affect the resulting absorbance. However, using a premixed solution further enhances convenience, especially when large numbers of samples are to be assayed. We therefore grouped these components of the assay mix into Solution-2 (Figure 1). Such a premixed solution was not feasible for the original Lowry assay (6) due to instability of the carbonate solution. The attempt to include Solution-3 in Solution-2 resulted in dramatic reduction in the development of blue color and was not considered further.
Protein estimation in colored biological samples
Protein extraction
Proteins from beetroot and blueberry were extracted in Triton X-100-NaCl solution with mild homogenization. Such homogenates retain their enzyme activities (15). This extraction was not required for red wine.
Eliminate interfering substances
For colored samples it is necessary to remove the interference due to the inherent sample color and other non-protein substances that react with the protein reagents before colorimetric protein assay. The novelty of U-2012 is in devising a decolorizing protocol compatible with a colorimetric protein assay.
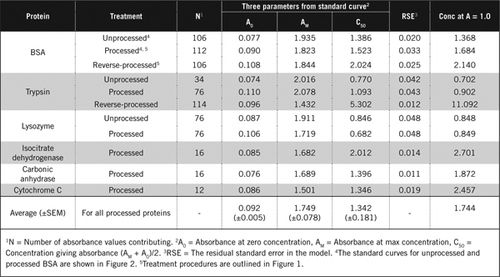
Decolorization of colored pigments by sodium hypochlorite or H2O2 and selective precipitation of proteins by PCA or TCA were considered for removal of interfering substances. Sodium hypochlorite, H2O2, TCA and PCA were evaluated for their compatibility with the U-2012 assay using BSA as the test protein. Between sodium hypochlorite and H2O2, only H2O2 was compatible as a precipitate was formed in the presence of hypochlorite. Proteins precipitated by TCA or PCA can be assayed by U-2012 after adequate neutralization of residual acid in the pellet. The superiority of PCA over TCA for protein precipitation has been reported (24,25). In contrast, in our comparative evaluation, revealed similar C50 values for PCA (1.395) and TCA (1.400). We preferred PCA because it is readily available as a pre-made solution (70% v/v) and therefore easily diluted to the required strength. TCA is a hygroscopic solid that is difficult to weigh precisely due to its variable water content.
There are two possible ways of combining PCA and H2O2. For “processed” proteins PCA treatment was followed by H2O2 treatment and for “reverse-processed” protein, H2O2 treatment preceded PCA precipitation. Advantages of using ‘processed' protein were the removal of a number of interfering substances in the supernatant and the possible inactivation of proteolytic enzymes during sample preparation. This was confirmed by assaying processed and reverse-processed trypsin and BSA (see Table 1). Only processed samples were used to determine the actual protein content of colored biological samples
 |
Both PCA and H2O2 treatments of colored samples were necessary for interference elimination in U-2012 assay. Acid precipitation alone of the colored samples did not remove interference completely. With all the colored samples, some color was discarded in the supernatant, but the pellets were also colored. Color was eliminated from the pellets by H2O2 treatment. Alkaline conditions were required for both effective decolorization by H2O2 (26) and the color development by Folin's reagent to ensure that protein levels are measured correctly. Although both NaOH and KOH could provide the required alkalinity, only NaOH was compatible with the U-2012 assay. A precipitate was formed in the presence of KOH. In pellets, the PCA was neutralized using Na2CO3 and NaOH (27). Additional NaOH was added during the assay; the optimized volume was between 50 to 70 µL (60 µL was routinely used); see Figure 1.
Beetroot, blueberry, and red wine were decolorized with 15 µL of 30% H2O2 taking 0.5 and 2 h at 50°C and room temperature, respectively. Twenty microliters of 30% H2O2 for 1 h at 50°C was used to cope with stronger colored samples. Oxidation of substances like sugars bound to proteins by H2O2 at 50°C seems critical as room temperature processing overestimates protein content. In the case of beetroot, 50°C processing reduced the apparent protein estimate to 14% of the unprocessed, whereas room temperature processing only halved that estimate.
It was evident from the colorimetric assays carried out after hydrogen peroxide treatment that some H2O2 was not utilized in the decolorization. In such a sample, the end color of the Lowry assay was partially destroyed. It was therefore necessary to destroy the remaining hydrogen peroxide before protein assay. There are two sources of H2O2 in the U-2012 assay; H2O2 added for decolorization and H2O2 present as a contaminant in the Triton X-100 (0.22%, Product information: Triton X-100, www.sigmaaldrich.com). Hydrogen peroxide is commonly degraded by the enzyme catalase. However, the high pH of the protein assay would inactivate known catalases. Also, adding catalase would lead to the addition of extra protein. We chose chemical destruction of H2O2 using pyruvate (28). The chemistry of the pyruvate-H2O2 interaction equation [4] is well established (28,29). Pyruvate destroys H2O2 at room temperature according to the following reaction: 
Residual H2O2 in the pellet suspension was destroyed by treating with 0.9 M pyruvate (1.5x concentration of H2O2) for 0.5 h at room temperature. To counteract the contaminating H2O2 in Triton X-100, extra pyruvate was also added in the protein assay (Figure 1). The addition of pyruvate gave lower absorbance for a non-protein blank [0.089 (with pyruvate) versus 0.104 (without pyruvate)]. We suggest that the peroxide contaminant in Triton X-100 reacts with the acetonitrile in Solution-2, giving slightly higher absorbency.
The color interference associated with the colored biological samples cannot simply be taken into account by running a protein assay in the absence of the Folin's reagent. The calculated ratios (Abs1-Abs2)/(Abs3-Abs4) indicated that interference from sample color was the highest for red wine ( = 40) and less for blueberry ( = 6) and beetroot ( = 2). This interference translated into the abnormally high estimates of true protein levels; for example, the concentration of protein using unprocessed and processed beetroot homogenates (20.21 versus 2.89 mg protein / g tissue, respectively). In addition to color interference, red wine and homogenates of beetroot and blueberry are likely to contain substances that will react with Folin's reagent in the U-2012 assay (e.g., small peptides and complex sugars). These were removed by selectively precipitating proteins with ice-cold PCA at a final concentration of 5% (Figure 1).
Standard curves and their parameters
Standard curves for unprocessed and processed BSA are shown in Figure 2. The derived parameters (A0, AM and C50) are also listed in Table 1 for BSA and other proteins.
The results show that the residual standard error in the model is low (0.012 to 0.048) indicating the better fit of the data to the rectangular hyperbola trend. For comparing information between various proteins and their processing, the parameters were converted to the concentration for absorbance = 1.0 at 650 nm (right column in Table 1).
These results show that loss of protein (compared with unprocessed protein) in processed samples was less than the reverse-processed samples. This loss was more apparent in the case of trypsin and it can be explained on the basis of its auto-catalytic activity during the reverse-processing. We recommend that the ‘processed' protocol (Supplementary Material) should only be followed for biological samples that are likely to contain proteolytic enzymes.
In the original Lowry assay (6) and its modified version U-1988 (15), only the linear portion of the standard curve obtained by plotting the absorbance against the amount of protein was used in the quantitative determination of protein. In the U-2012 assay we use the data more effectively by fitting a rectangular hyperbola equation as described in the Materials and methods section in line with Coakley and James (20).
Protein content of colored homogenate
Protein concentrations in unknown samples were calculated by equation [2] and [3] against processed BSA standard and the average of all processed proteins listed in Table 1. The latter will be closer to a true estimate for biological samples that contain a mixture of proteins. We estimated the amounts of protein in blueberry and beetroot relative to red wine as approximately 60 and 230-fold respectively (Table 2).
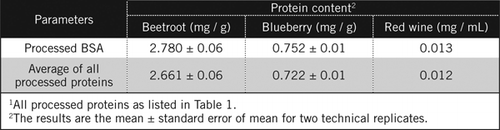 |
Like BSA, red wine and 50% homogenates of beetroot and blueberry were processed by PCA precipitation and decolorization by H2O2 (Figure 1). At this stage the biological samples were concentrated 40 times for red wine and 4 times for beetroot and blueberry. Similarly BSA (2 mg/mL) was also concentrated 4 times to 8 mg/mL. The absorbance of the colored samples that was close to the absorbance for C50 (for unprocessed BSA) was used to calculate the protein content, as described by equation [2] and [3].
In conclusion, the U-2012 assay has employed stable reagents, provided improved sensitivity (even for colorless biological samples) and overcome color-induced interference for colored biological samples. The U-2012 assay is not constrained to the linear portion of the response between protein concentration and absorbance and makes more efficient use of data in the nonlinear region through a rectangular hyperbolic curve model fitted to the standards using simple procedures within Microsoft Excel.
Acknowledgments
Authors acknowledge the Foundation for Research, Science and Technology New Zealand for financial support (C06X0809).
Competing interests
The authors declare no competing interests.
Supplementary data
To view the supplementary data that accompany this paper please visit the journal website at: www.future-science.com/doi/suppl/10.2144/000113818
References
- 1. . 1985. Determination of microgram quantities of protein in the presence of milligram levels of lipid with amido black 10B. Anal. Biochem. 150:97–104.
- 2. . 1949. Determination of serum proteins by means of the biuret reaction. J. Biol. Chem. 177:751–766.
- 3. . 1985. Measurement of protein using bicinchoninic acid. Anal. Biochem. 150:76–85.
- 4. 1976. A rapid and sensitive method for the quantification of microgram quantities of protein utilizing the principle of protein-dye binding. Anal. Biochem. 72:248–254.
- 5. . 1996. Linearization of the Bradford protein assay increases its sensitivity: theoretical and experimental studies. Anal. Biochem. 236:302–308.
- 6. . 1951. Protein measurement with the Folin phenol reagent. J. Biol. Chem. 193:265–275.
- 7. 1979. Review of the folin phenol protein quantification method of Lowry, Rosebrough, Farr and Randall. Anal. Biochem. 100:201–220.
- 8. . 1999. Colorimetric protein assay techniques. Biotechnol. Appl. Biochem. 29:99–108.
- 9. . 2007. Comparison of five methods for determination of total plasma protein concentration. J. Biochem. Biophys. Methods 70:709–711.
- 10. . 2005. The most highly cited paper in publishing history: protein determination by Oliver H. Lowry. J. Biol. Chem. 25:280.
- 11. . 2010. Thorough study of reactivity of various compound classes toward the Folin-Ciocalteu Reagent. J. Agric. Food Chem. 58:8139–8144.
- 12. . 1969. Interference by oxidized lipids in the determination of protein by the Lowry procedure. Anal. Biochem. 30:386–390.
- 13. . 1975. A simple technique for eliminating interference by detergents in the Lowry method of protein determination. Anal. Biochem. 64:136–141.
- 14. . 1991. Possible protein-polysaccharide complexes in red wines. Am. J. Enol. Vitic. 42:150–152.
- 15. . 1988. Protein estimation in tissues containing high levels of lipid: modifications to Lowry method of protein determination. Anal. Biochem. 168:421–427.
- 16. . 1991. Preparation of representative homogenates of biological tissues: effect of salt on protein extraction. Anal. Biochem. 198:298–301.
- 17. . 2011. Quantitative Colorimetric Assay for Total Protein Applied to the Red Wine Pinot Noir. J. Agric. Food Chem. 59:6871–6876.
- 18. . 2009. Analysis of Protein Composition of Red Wine in Comparison with Rosé and White Wines by Electrophoresis and High-Pressure Liquid Chromatography-Mass Spectrometry (HPLC-MS). J. Agric. Food Chem. 57:4328–4333.
- 19. . 2009. A stable and sensitive protein assay (U-2009 modified assay) for colored biological samples. ComBiol., New Zealand Final Programme December 2009. University of Canterbury, Christchurch, New Zealand.
- 20. . 1978. A simple linear transform for the Folin-Lowry protein calibration curve to 1.0 mg/mL. Anal. Biochem. 85:90–97.
- 21. . 2000. Mixed-Effects Models in S and S-PLUS, Statistics and Computing Series. Springer-Verlag, New York, NY.
- 22. . 2009. R: A language and environment for statistical computing. R Foundation for Statistical Computing, Vienna, Austria, ISBN 3-900051-07-0, URL http://www.R-project.org.
- 23. . 1988. Liquid chromatographic artifacts and peak distortion: Sample-solvent interaction in the separation of carotenoides. Anal. Chem. 60:807–811.
- 24. 1970. Determination of lead chelated with ethylenediaminetetra-acetic acid in blood after precipitation of protein with perchloric acid. Brit. J. Industry Med. 27:40–42.
- 25. . 1990. Perchloric and trichloroacetic acids as precipitants of protein in endogenous ileal digesta from the rat. J. Sci. Food Agric. 52:13–21.
- 26. . 1983. Alkali-induced decomposition of hydrogen peroxide. J. Chem. Soc., Dalton Trans. 11:2353–2357.
- 27. 1988. Protein Purification: Principles and Practice, Second Ed. Springer-Verlag New York Inc., New York, NY.
- 28. . 1998. Studies on aromatic amino acid oxidase activity in ram spermatozoa: role of pyruvate as an antioxidant. Anim. Reprod. Sci. 51:275–287.
- 29. 1904. Notice sur l'action de l'eau oxygenee sur les acids α-cetoniques et sur les dicetones 1.2. Recl. Trav. Chim. Pays-Bas Belg. 23:169–172.


