


Two-step protocol for preparing adherent cells for high-throughput flow cytometry
Abstract
We have developed a simple, cost-effective, and labor-efficient two-step protocol for preparing adherent cells for high-throughput flow cytometry. Adherent cells were grown on microplates, detached with 2.9 mM EDTA (pH 6.14) added directly to wells containing cell culture medium, stained, and then analyzed on a flow cytometer. This protocol bypasses washing, centrifugation, and transfer between plates, reducing the cell loss that occurs in standard multistep protocols. The method has been validated using six adherent cell lines, four commercially available dyes, and two antibodies; the results have been confirmed using two different flow cytometry (FC) instruments. Our approach has been used for estimating apoptosis, mitochondrial membrane potential, reactive oxygen species, and autophagy in response to exposure to pure compounds as well as plant and bacterial extracts.
We describe a simple two-step method to detach adherent cells for high throughput flow cytometry (FC) by adding an EDTA solution directly to cells in culture media. This method does not require inactivation of the EDTA solution or washing of the detached cells, which can be stained with dye in the presence of the EDTA solution and then analyzed directly using FC.
Since its inception and commercialization in the 1960s, flow cytometry (FC) has emerged as an indispensible tool for cell biology research. Although FC provides the most accurate quantitative measure of labeled cells in diagnostics, research, and drug discovery applications, its use is limited to cells in suspension (1). Because suspending adherent cells is laborious and time-consuming (2), the applicability of FC to high-throughput screening (HS) in 96- and 384- (or more) well plates is limited (3, 4). Classically, adherent cells are detached with trypsin/EDTA and subjected to various wash and centrifugation steps before staining and transfer to microplates for FC (Figure 1A). To bypass these problems, we present a protocol using EDTA as a cell detachment reagent that allows direct culture, detachment, and staining of cells (with membrane-permeable dyes and surface antibodies) on microplates. The advantages of our protocol over the conventional protocol (5, 6) are listed in Figure 1B.
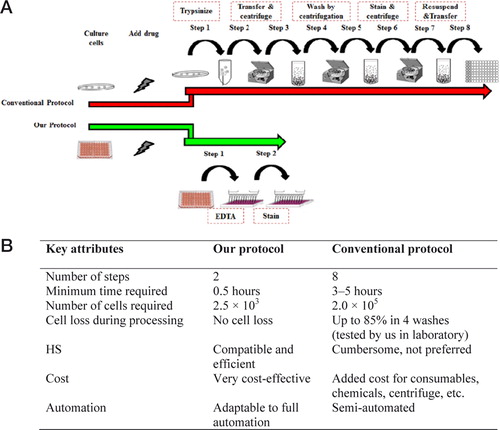
(A) The conventional protocol involves multiple steps, including removing medium, adding trypsin/EDTA, transferring cells to tubes for centrifugation, washing cell pellets with PBS, staining and washing again by centrifugation, re-suspending cells, and then transferring cells to microplates for FC. Our two-step cell detaching protocol simply involves adding EDTA to cells in culture medium, waiting until the cells detach, adding stain to the medium and then subjecting cells to FC. (B) Comparison of key attributes of our protocol and the conventional protocol.
Adherent cells express protein molecules and receptors, including E-cadherins (7, 8) and integrins, which are involved in cell-to-cell adhesion and extracellular matrix attachments (9) and require Ca2+, Mg2+, and Mn2+ for proper function (10, 11). Conventionally, 0.25% or 0.05% trypsin, both in an 0.53 mM EDTA (a chelator of divalent and trivalent ions) solution, is used for enzymatic detachment of adherent cells (12). However, non-enzymatic methods (such as EDTA) have been recommended over enzymatic methods to detach adherent cells for FC (12) and for passaging and colony expansion of human pluripotent stem cells (13). The benefits of using 2.9 mM EDTA (pH 6.14) as described in our protocol (versus conventionally used concentrations of trypsin or trypsin/EDTA) are: no enzymatic inactivation is required, cell surface markers are conserved, cell viability is extended (up to 3 h), and the protocol is relatively simple. Our protocol has been validated on six adherent cell lines, representing breast, cervical, prostate, and fibrosarcoma cancer types and normal fibroblasts, using four commercially available dyes and two antibodies; results have been obtained and confirmed utilizing two cytometry machines: a high-throughput flow cytometer (Accuri C6 HTFC Screening System) and the BD LSRFortessa.
Materials and methods
Cell lines, reagents, and equipment
All cell lines used were obtained from ATCC (Manassas, VA): HeLa (human cervical adenocarcinoma; ATCC CCL-2); MCF-7 (human breast adenocarcinoma; ATCC HTB-22); BT20 (human breast carcinoma, ATCC HTB-19); DU145 (human prostate carcinoma; ATCC HTB-81); HT1080 (human fibrosarcoma; ATCC CCL-121); and BJ (human skin fibroblasts; ATCC CRL-2522). Reagents used were: Dulbecco's Modified Eagle Medium (DMEM) (Gibco cat no. 31966 021; Invitrogen, Paisley, UK) supplemented with 10% FBS (Gibco) and 5% penicillin (100U/ml) and streptomycin (100 µg/ml) (Gibco cat. no. 15140-122); APOPercentage dye (Biocolor, Carrickfergus, UK); JC-1 (5,5′,6,6′-tetrachloro-1,1′,3,3′- tetraethylbenzimi-dazolylcarbocyanine iodide) (Cat. no. T3168; Life Technologies) (Life Technologies, Warrington, UK); DCFDA (2', 7'-dichlorofluorescein diacetate) (Cat. no. 6883; Sigma Aldrich GmbH, Schnelldorf, Germany); H2O2 (Cat. no. H1009; Sigma Aldrich GmbH); DMSO (Cat. no. D2650; Sigma Aldrich GmbH); EDTA (ethylenediaminetetraacetic acid disodium salt dihydrate) (Cat no. E5134; Sigma Aldrich GmbH); and tamoxifen (MP BioMedicals cat. no. 156738; Fisher Scientific, Suwaness, USA). The microplates used were: 96-well plate (Costar cat no. 3598) (Corning, NY, USA) and 384-well plate (Nunc cat no. 164688) (Thermo Scientific, Waltham, MA). The following equipment was used: Accuri C6 HTFC Screening System (IntelliCyt Corporation, Albuquerque, NM); BD LSRFortessa (BD Biosciences, San Jose, CA); orbital shaker (IKA MS3 digital; VWR International, Batavia, IL); tissue culture hood (NuAIRE Biosafety Level 2 cabinet; NuAIRE, Plymouth, MN); Primo Vert inverted microscope (Cat No: 415510-1101-000) (Carl Zeiss Microscopy GmbH, Göttingen, Germany); cell culture incubator (37°C, 5% CO2, Series II water jacket incubator) (Thermo Scientific); and Finnpipette F1 multichannel pipettes (1-10 µl, 5-50 µl, and 30-300 µl) (Thermo Scientific). The following software applications were used: FlowJo version 7.6.5 software (Tree Star Inc. Ashland, OR) and ForeCyt version 4.1 (R1) software (IntelliCyt Corporation, Albuquerque, NM).
Reagent preparation
Stock EDTA solution (250 mM) was prepared by adding 18.6 g EDTA to 150 mL deionized H2O, adjusting the pH at 6.14 with HCl, and bringing the final volume to 200 mL. The solution was sterilized by autoclaving and then stored at room temperature. We have stored the stock solution for as long as 2 years and confirmed that it was still active.
The working EDTA solution was prepared by diluting the stock 250 mM EDTA solution to 15 mM in deionized H2O.
The JC-1 working solution was prepared by diluting JC-1 dye to 2 mM in DMSO. This solution was then diluted in serum-free medium before addition to cells to achieve a final concentration of 2 µM in a total volume of 77 µl.
The DCFDA stock solution was prepared by diluting DCFDA in DMSO to 10 mM.
APOPercentage dye was prepared by adding 1 µl dye (as provided by supplier) to 14 µl serum-free medium and adding the full 15 µl to cells.
Development of the protocol
Our generalized protocol (which is described in detail in the Supplementary Protocol) includes plating cells in microplates, adding test compounds in desired concentrations for the required time, adding EDTA and incubating for 15–45 min (depending on the cell line), and then finally adding dye and analyzing by FC. Development of the protocol involved extensive testing to optimize multiple variables such as cell numbers, the concentration and pH of EDTA used, the optimal length of EDTA treatment to avoid cell damage, and the amount of dyes to be used. While optimizing these variables, we also used stringent parameters to evaluate the final results such as number of cells analyzed per well and limiting staining/reactive oxygen species (ROS)/mitochondrial outer membrane potential (MOMP) in the negative control to approximately 10% or less. For detaching cells in the presence of medium, several attempts were made by varying the final concentration (1.6–3.8 mM) and pH (4.0–11.0) of EDTA while maintaining stringent parameters. Step-by-step optimization of the protocol was carried out in a 96-well plate, and eventually several commercially available membrane-permeable dyes were tested to establish a streamlined protocol that can be easily adapted for HS. To demonstrate this, we focused on robust quantifiable features of apoptosis such as phosphatidylserine exposure on cell membranes using APOPercentage dye, disruption of MOMP using JC-1 dye, and generation of ROS using DCFDA. The protocol has also been tested to quantify autophagy (14), and antibody staining against cell surface markers CD44 and EGFR has also been successfully achieved (Supplementary Material). Successful testing in the 384-well plate format has also been achieved in three cell lines using the APOPercentage, JC-1, and ROS assays (Supplementary Material).
Results and discussion
The success of our protocol was dependent on the cell detachment efficiency of EDTA when added to the medium. Initially, MCF-7 cells were grown in 40 µL medium overnight, and the next day 20 µL of working EDTA solution (0.2, 0.5, 1.0, 1.5, 2.5, 3.0, 3.5, 4.0, 4.5, 5.0, and 10.0 mM) was added to the cultured cells. The cells were visually inspected under the microscope. We noticed that no cell detachment was observed at EDTA concentrations <5 mM, and fewer cells were detached at 5 mM, whereas 10 mM EDTA was able to loosen cells, but pipetting was required to detach cells completely. The cells were stained with APOPercentage dye (1 µL dye in 20 µL medium per well) for 12 min, and the percentages of stained cells in the positive and negative controls were ∼70% and ∼10%, respectively. With increased incubation time in the dye, the percentages of cells stained in the positive and negative controls were 90% and 25%, respectively. We also found that cells detached with EDTA at pH values outside the range 6.14–6.50 showed decreased viability (either cells rapidly underwent apoptosis or were lysed), and these cells were not tested further. We have, however, noticed that cells exposed to 100% EDTA at pH 6.14–6.50 swell up and stain 100% positive for apoptosis using APOPercentage dye (this could be used as a positive control for apoptosis). We decided to use EDTA solution at pH 6.14 (over time the pH may rise to 6.50 during storage at room temperature) to optimize the protocol without pipetting while limiting the percentages of stained cells in the positive and negative controls to >90% and <10%, respectively. In other cell lines (DU145 and HepG2), 12 µL of 10 mM EDTA took more than 45 min to detach the cells. We therefore decided to increase the concentration of EDTA to 20.0 mM, along with optimizing other parameters such as no pipetting and optimal staining in the positive and negative controls. During the standardization of the protocol, we realized that an intricate balance of many factors (volume of medium needed to culture cells, volume and concentration of EDTA needed to detach cells, volume and concentration of the dye used to stain cells, and incubation time) was required. Eventually, we established that when cells are grown in 50 µL of medium, 12 µL 12.5–17.5 mM EDTA is added, and 15 µL dye is added, optimal results are obtained within a specific time period depending on the cell line.
The time needed to detach adherent cells and their stability (morphology and amount of staining in negative samples) in EDTA (before and after adding stain) varies among cell lines (Table 1). Cells with spindle-like morphology tend to separate better into single cell suspensions (Figure 2, A and B) during incubation with EDTA. With APOPercentage staining, negative (Figure 2C) and positive (Figure 2D) control cells can be easily differentiated under a light microscope. APOPercentage dye labels cells undergoing apoptosis when membrane movement occurs and phosphatidylserine is exposed in the outer leaflet (15). Untreated and drug-treated cells can accurately be distinguished by FC as the dye fluoresces in the FL-2 channel with an emission wavelength of 590–600 nm. The cells were analyzed on a BD LSRFortessa by applying gates on forward scatter (FSC-H) and side scatter (SSC-H), and the percentage apoptosis in positive cells treated with 10 mM H2O2 was determined in the FL2-H channel. Data were analyzed using FlowJo v7.6.5 (Figure 2E). To test the reproducibility of measurements using this protocol, MCF-7 cells treated with the indicated concentrations of tamoxifen for 3.5 h were detached with EDTA and stained with APOPercentage dye. Apoptosis-positive cells were determined in the FL2-H channel and analyzed with the Accuri C6 HTFC Screening System using ForeCyt v4.1 software (Figure 2F). Under the optimized conditions defined in our protocol, the counterstaining of negative/untreated cells is limited to 10% (cells naturally undergoing apoptosis). The protocol can be used to accurately estimate the variation in the number of apoptotic cells induced by different drug concentrations (Figure 2F).
 |
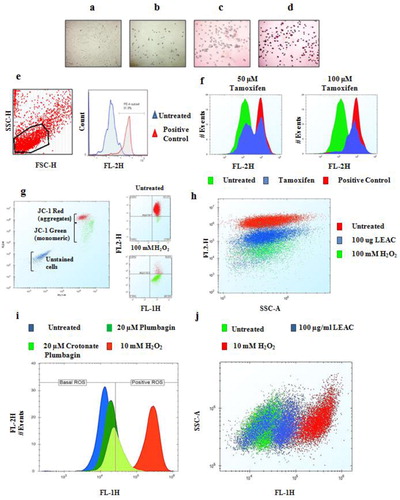
Cells were grown and stained as described in our protocol. Cells were photographed at different stages during the protocol: (A) adherent HT1080 cells, (B) cells detached with EDTA in the presence of medium, (C) negative control (untreated) sample stained with APOPercentage dye, and (D) positive control (10.0 mM H2O2 treated) sample stained with APOPercentage dye. (E) After detaching and staining, apoptosis was captured in the negative and positive control samples using the BD LSRFortessa. (F) Separation of negative (untreated) and positive (treated with tamoxifen as indicated) cells stained with APOPercentage dye and analyzed using the Accuri C6 HTFC Screening System. (G) Estimating MOMP in DU145 cells untreated or treated with 100 mM H2O2 using the BD LSRFortessa (left panel) and the Accuri C6 HTFC Screening System (right panel) (H) Estimating mitochondrial outer membrane potential (MOMP) in BT20 cells treated with plant extract (as indicated for 24 h) using the Accuri C6 HTFC Screening System. (I) MCF-7 cells untreated or treated with the indicated concentrations of plumbagin, crotonate plumbagin, or 10 mM H2O2 were stained with 10 µM DCFDA, and reactive oxygen species (ROS) were estimated in the FL-1H channel using the Accuri C6 HTFC Screening System. (J) ROS levels in BT20 cells treated with 100 µg/mL LEAC extract were estimated using DCFDA dye by capturing fluorescence using the Accuri C6 HTFC Screening System. The data were analyzed using ForeCyt v4.1 software. Images are representative of at least three independent experiments.
The protocol was further utilized to assess MOMP using JC-1 dye. JC-1 is a membrane permeable dye that accumulates in the mitochondria as it is attracted to the high electrochemical-gradient maintained within the inner membrane space (16). Accumulated JC-1 forms J-aggregates, which fluoresce red at 580–590 nm and can be detected in the FL-2 channel. In cells undergoing apoptosis, MOMP is often disrupted; therefore, JC-1 cannot aggregate and remains in a monomeric state resulting in a fluorescence emission of 530 nm (green fluorescence). This unique characteristic allows for the identification of cells with dysfunctional mitochondria. Disruption of the MOMP in DU145 cells treated with 100 mM H2O2 was compared with untreated cells by staining with JC-1 dye and was analyzed using a BD LSRFortessa (left panel, Figure 2G) and the Accuri C6 HTFC Screening System in the FL-2H versus FL-1H channel (right panel, Figure 2G). Different populations of cells were very well separated based on fluorescence (left panel, Figure 2G). The analysis revealed that >95% cells in the untreated sample accumulated JC-1 dye (red) and >90% of the treated cells had JC-1 dye in the monomeric form (green), which indicated MOMP disruption. Further validation was performed in BT20 cells that were untreated or treated with 100 mg/mL leaf ethyl acetate (LEAC) extract of Avicennia marina or 100 mM H2O2 and then stained with JC-1 dye using. The data were captured using the Accuri C6 HTFC Screening System and analyzed using ForeCyt v4.1 software in the FL-2H versus the SSC-A channel (Figure 2H). We also showed that our protocol can capture MOMP recovery over time (14).
The DCFDA fluorescent probe is a membrane permeable molecule that is cleaved by esterases present in the intracellular space and is retained within the cells. Once oxidized by ROS, DCFDA is converted to highly fluorescent DCF, which fluoresces at 527 nm and thus provide an estimate of ROS levels (17). We demonstrate that our protocol can help to estimate ROS generation in cancer cells in response to pure compounds such as plumbagin and its derivative crotonate plumbagin (Figure 2I). A greater than one-fold log shift to the right should be observed when using H2O2 as a positive control. The protocol can be used to determine ROS levels in response to a plant extract as demonstrated in BT20 cells treated with 100 µg/mL of LEAC in the FL-1 channel (Figure 2J). The percentages of untreated and treated control cells stained when incubated with the various membrane permeable dyes in a 96-well plate are summarized in Table 2. Traditionally, colorimetric plate reader–based methods such as MTT (3-(4,5-dimethylthiazol-2-yl)-2,5-diphenyltetrazolium bromide) are used to measure cellular growth and survival of adherent cells (18). The MTT assay on adherent cells is preferred to FC because no washing steps are involved, and it provides rapid results. The advantages (ability to handle a large number of samples, precision, and specificity in detecting viable cells quantitatively) of FC over the MTT assay have been demonstrated (19). Moreover, FC allows multiplexing using different florescent tags, leading to exponential gains in productivity and information (1). The lack of efficient methods to bring adherent cells to suspension has limited the use of FC to suspension cell cultures. To fill this gap, we developed the above-described protocol.
 |
We believe the simplicity of our protocol makes it a versatile and inexpensive tool for using adherent cells, not only for HS, but also as a potential household protocol for any laboratory using adherent cell lines for research because the protocol is compatible with a wide range of cell biology assays. We believe that this protocol could also help to maximize the use of the National Cancer Institute's famous 60-cell-line panel (53 of which are adherent cell lines) to expand the cancer pharmacology database (20) and to accelerate the identification of new chemical entities under the Molecular Libraries Initiative (2). Adaptation to a 384-well plate (Supplementary Material), or in the future to a 1536-well plate format, also opens the door to new comprehensive applications of this protocol.
Author contributions
M.K. conceptualized the study and outlined the protocol. M.K. and L.E. performed standardization of the protocol and data analysis. L.E. helped refine the protocol and performed the majority of laboratory testing, including buffer formulations, cell staining, and flow cytometry.
Acknowledgments
We thank King Abdullah University of Science and Technology for providing funds for this work.
Competing interests
Authors declare the following patent application as a potential conflict of interest: Kaur M, Esau L. “Method of detaching adherent cells for flow cytrometry.” Patent Application No: PCT/US14/13597; Filing date: January 29, 2014. Please note that the method is not commercialized, and the authors do not receive any royalties.
Supplementary data
To view the supplementary data that accompany this paper please visit the journal website at: www.future-science.com/doi/suppl/10.2144/000114325
References
- 1. . 2011. Cell-based screening using high-throughput flow cytometry. Assay Drug Dev. Technol. 9:13–20.
- 2. . 2010. High throughput flow cytometry for discovery at UNMCMD and the NIH Molecular Libraries Initiative. Drug Discovery World 2010:35–46.
- 3. . 2001. HTPS flow cytometry: a novel platform for automated high throughput drug discovery and characterization. J. Biomol. Screen 6:83–90.
- 4. . 2007. High-throughput flow cytometry for drug discovery. Expert Opin Drug Discov. 2:685–696.
- 5. . 2013. Induction of apoptosis in cancer cell lines by the Red Sea brine pool bacterial extracts. BMC Complement. Altern. Med. 13:344.
- 6. . 2014. Cytotoxicity and apoptosis induced by a plumbagin derivative in estrogen positive MCF-7 breast cancer cells. Anticancer. Agents Med. Chem. 14:170–180.
- 7. . 1999. Recycling of E-cadherin: a potential mechanism for regulating cadherin dynamics. J. Cell Biol. 146:219–232.
- 8. . 1989. Cadherin cell-adhesion molecules in human epithelial tissues and carcinomas. Cancer Res. 49:2128–2133.
- 9. 1990. Cadherins: a molecular family important in selective cell-cell adhesion. Annu. Rev. Biochem. 59:237–252.
- 10. . 2011. Integrin structure, activation, and interactions. Cold Spring Harb. Perspect. Biol. 3:a004994.
- 11. . 2000. Functional interaction between E-cadherin and alphav-containing integrins in carcinoma cells. J. Cell Sci. 113:425–437.
- 12. . 2012. Different methods of detaching adherent cells significantly affect the detection of TRAIL receptors. Tumori 98:800–803.
- 13. . 2012. Passaging and colony expansion of human pluripotent stem cells by enzyme-free dissociation in chemically defined culture conditions. Nat. Protoc. 7:2029–2040.
- 14. . 2015. Autophagy inhibition enhances the mitochondrial-mediated apoptosis induced by mangrove (Avicennia marina) extract in human breast cancer cells. European Journal of Medicinal Plants 5:304–317.
- 15. . 2013. Involvement of Toll-like receptor 2 in apoptosis of Aggregatibacter actinomycetemcomitans-infected THP-1 cells. J Microbiol Immunol Infect. 46:164–170.
- 16. . 2012. JC-1: alternative excitation wavelengths facilitate mitochondrial membrane potential cytometry. Cell Death Dis. 3:e430.
- 17. . 2013. Cuprous oxide nanoparticles inhibit the growth and metastasis of melanoma by targeting mitochondria. Cell Death Dis. 4:e783.
- 18. 1983. Rapid colorimetric assay for cellular growth and survival: application to proliferation and cytotoxicity assays. J. Immunol. Methods 65:55–63.
- 19. . 1997. A rapid method for evaluation of cell number and viability by flow cytometry. Cytotechnology 24:161–168.
- 20. . 2013. The exomes of the NCI-60 panel: a genomic resource for cancer biology and systems pharmacology. Cancer Res. 73:4372–4382.


