


Assessing the matrix effects of hemolyzed samples in bioanalysis
Abstract
Nicola Hughes obtained her PhD in 1992 in Biochemistry at the University of London, UK, where she studied the covalent binding of carcinogenic polyaromatic hydrocarbons to DNA in mouse tissues using the 32P-postlabelling technique. She did her postdoctoral fellowship at the Hospital for Sick Children in Toronto. She specialized in the development of phenotyping and genotyping methods to investigate the pharmacogenetic variations in the N-acetyl transferases in relation to bladder cancer susceptibility and exposure to aromatic amines. She has been at Biovail Contract Research since 1997, when she first joined the Bioanalytical Laboratory as a Senior Scientist in the Method Development Group and is currently the Director of the Bioanalytical Laboratory. Over the years, Nicola has been responsible for providing leadership in the development and application of novel and highly sensitive LC–MS/MS bioanalytical methods and has improved the method validation process at Biovail Contract Research. Nicola is a member of the American Society of Mass Spectrometry and American Society of Pharmaceutical Scientists. She has published more than 20 articles in peer-reviewed journals and presented more than 60 posters and oral presentations at scientific meetings.
Validation of LC–MS/MS assays includes an assessment of matrix effects. Hemolysis effect, a special type of matrix effect, can also have an impact on analyte quantitation. In situations where the hemolysis effect is marginal, this can be resolved simply by dilution of hemolyzed samples with plasma prior to analysis. However, in some cases, the impact can be so dramatic that analytes are completely immeasurable. In such situations, modification to the bioanalytical method will be required, including, but not limited to, adjusting the chromatographic conditions to separate interferences present in hemolyzed samples; additional sample clean-up techniques such as protein precipitation in combination with SPE or a change in extraction technique such as from SPE to a liquid–liquid extraction method. Here, we report examples from four bioanalytical methods, where the presence of hemolyzed blood in plasma was found to have an impact on analyte quantitation and a description of the solutions adopted to resolve this are provided.
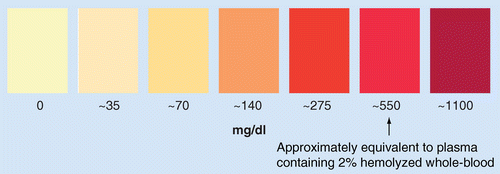
Relative Hemolysis Scale image is used with permission from Becton, Dickinson and Co., Franklin Lakes, NJ, USA.

AT: Atorvastatin; ISTD: Internal standard.

AT: Atorvastatin; ISTD: Internal standard.


QC: Quality control.

QC: Quality control.
QC: Quality control.
LC–MS/MS application in bioanalysis is a very powerful technique due to its inherent high sensitivity and selectivity. Matrix effects, first described in the 1990s [1], for LC–MS/MS analyses have been reported for a number of biological matrices, including plasma, whole-blood and serum [2–8]. Matrix effects result from endogenous interferences (e.g., phospholipids) in extracted samples that co-elute with the analyte of interest and thereby compete with analyte ions for gas-phase droplet formation, resulting in ion suppression or ion enhancement. Matrix effects are common and, provided the overall signal suppression or enhancement is consistent between matrix sources, acceptable [9,10]. Inconsistent matrix effects between matrices, can affect a method’s overall accuracy and precision and thereby its quantitative application. In such cases, modification of the method using additional sample clean-up [5], modification of chromatographic conditions, dilution of samples and reduction of matrix volume are typical examples of solutions employed to eliminate the impact of matrix effects. Assessment of matrix effects during method validation for LC–MS-based assays is routinely carried out [9,10].
Hemolysis is a process that occurs during or after blood collection, in which lysis of red blood cells results in the release into plasma of blood pigments such as hemoglobin and bilirubin and elevated salt concentrations such as potassium, which results in a pink to red discoloration of the plasma [11]. In clinical diagnostic research, hemolysis has been reported to interfere with spectrophotometric methods. The amount of analyte interference will depend on the relative degree of hemolysis or the extent of discoloration of the sample (Figure 1) and has been the reason for sample rejection in clinical diagnostic labs. During the conduct of a clinical study for drug pharmacokinetic (PK) analysis, blood samples are drawn at various sampling time points and processed typically into plasma or serum for subsequent LC–MS/MS analysis. While steps to minimize hemolysis are taken at the time of blood draw (e.g., use of direct venipucture as opposed to use of a plastic indwelling catheter, careful handling during blood sample taking, processing and transport) some hemolyzed samples are unavoidable. Rejection of hemolyzed samples from a PK study is not a practice that is encouraged. It can lead to incomplete plasma concentration–time profiles that, particularly around Cmax, could potentially impact the outcome of the study. Hemolysis effect is therefore a special type of matrix effect that includes the impact of the contents of lysed red blood cells on analyte quantitation. Hemolysis effect, if found, can have a dramatic impact on analyte quantitation and require modification of the extraction and/or chromatographic techniques to ensure the application of rugged accurate and precise bioanalytical methods to support clinical trials.
Failures encountered
In our laboratory, during the course of method development/validation, hemolysis effect is assessed in plasma that is purposely spiked with hemolyzed whole-blood (2% v/v) to generate a visibly severely hemolyzed sample. The quantitation analysis of an analyte in plasma and hemolyzed plasma at low and high analyte concentrations is then determined. If there is less than a 15% difference in the amount found in plasma compared with hemolyzed plasma, the method is shown to have no hemolysis effect.
Here, we report results for four different assays (Table 1) in which hemolyzed samples were initially found to have an impact on the quantitation of the analytes. In some cases, the effect was so significant that even at high analyte concentrations, close to the upper limit of quantitation, ion suppression in hemolyzed samples yielded undetectable analyte levels. In each case, a modification to the method was required to eliminate/minimize the impact and allow subsequent method validation.
The solution
▪ Analysis of atorvastatin & metabolites in human plasma
Atorvastatin, its metabolites O-hydroxy atorvastatin, P-hydroxy atorvastatin and the internal standard, atorvastatin-d5, are extracted from human plasma (0.20 ml) by liquid–liquid extraction (LLE). An aliquot of the extract is injected into an LC–MS/MS system. The analytes are separated by HPLC using reversed-phase chromatographic conditions, detected by a tandem mass spectrometer.
Analysis of hemolyzed plasma samples revealed a visible interference with a retention time close to that of the internal standard, deuterated atorvastatin (Figure 2). This interference consequently had an impact on the quantitation of atorvastatin in low concentration samples (Table 2). The solution to this problem was a slight adjustment to the organic and aqueous portion of the mobile phase, in order to improve the chromatographic separation of the interference from the internal standard (Figure 3). Under these improved conditions, there was no hemolysis impact on the assay (Table 2).
▪ Analysis of phenylephrine in human plasma
Total phenylephrine (free and conjugated) was determined in human plasma (0.2 ml) by hydrolysis of conjugates using β-glucuronidase, followed by extraction. Phenylephrine and the internal standard were extracted by SPE. An aliquot of the extract was injected into an LC–MS/MS system. The analytes were separated by HPLC using hydrophilic interaction LC conditions and detected using a tandem mass spectrometer.
The bioanalytical method for total phenylephrine in human plasma was originally validated using a close structural analog, differing from phenylephrine by a single hydroxyl group (Figure 4). Phenylephrine and its analog internal standard demonstrated close chemical properties, with more than 85% extraction recoveries and relative retention time (phenylephrine to internal standard) of 0.9. During the assessment of the impact of hemolysis effect, greater than 15% difference was observed in hemolyzed samples at both high and low concentrations compared with plasma samples. This impact can be eliminated simply by dilution of hemolyzed samples 1:1 with plasma to reduce the degree of hemolysis to 1% (Table 3). Application of this method in sample analysis is therefore only valid in nonhemolyzed or marginally hemolyzed plasma. Severely hemolyzed samples are reportable only after dilution to a lesser degree of hemolysis. While this approach affords a simple solution to the problem, it has the disadvantage that severely hemolyzed samples that fall below the limit of quantitation, due to the dilution, will give nonreportable values. Further improvements to the method were made, including a substitution of the internal standard from an analog to a deuterated internal standard, where extraction recoveries were greater than 88% and the relative retention time (phenylephrine to internal standard) was 1.0. With this method modification, the impact from hemolysis effect on phenylephrine was matched by the deuterated internal standard and therefore hemolysis effect, even in severely hemolyzed samples, had no impact on analyte quantitation (Table 3). These findings clearly demonstrate the potential disadvantages of even very close structural analogs as candidates for assay internal standards. Here, a more rugged and reliable method was developed that utilized a deuterated internal standard to compensate for the hemolysis effect.
▪ Analysis of carvedilol & metabolites in human plasma
Carvedilol, its metabolites O-desmethylcarvedilol, 4´-hydroxyphenylcarvedilol and 5´-hydroxyphenylcarvedilol and the internal standard desacetyldiltiazem were extracted from human plasma (0.30 ml) by SPE. The analytes were separated by HPLC using reverse-phase chromatographic conditions and detected using a tandem mass spectrometer.
Using this method, hemolysis effect for the assay for carvedilol and its metabolites in human plasma was assessed. The hemolysis effect was found to be dependant on analyte concentration and had no impact on the parent drug, carvedilol, which was present at concentrations 20-times higher than those of the metabolites. Accurate quantitation of the metabolites was not possible in hemolyzed samples, as the metabolite responses were either severely suppressed or totally undetectable (Table 4, Figure 5). The SPE method was accordingly reviewed and no further refinements to the wash/elution conditions could be applied to resolve the observed hemolysis effect. It was also clearly evident that the final extracts of hemolyzed samples were still discolored after extraction, indicative of the co-extraction of strongly colored blood pigments such as hemoglobin or bilirubin. The extraction method was therefore modified to include a protein precipitation step prior to SPE analysis to remove hemoglobin, and an additional acid wash step was added to the SPE method to facilitate the elimination of any residual ‘heme ions’. With these modifications, the method was subsequently revalidated to verify that there was no hemolysis effect on the accurate quantitation of each of the analytes and the method was suitable for PK application (Table 5).
▪ Analysis of olazapine in human plasma
The olanzapine method was initially developed in human plasma using Waters HLB SPE cartridges, using carefully selected wash and elution solvent conditions (maximum organic wash and minimum organic elution). Despite the use of a deuterated internal standard during the assessment of the hemolysis effect, a huge amount of ion suppression was evident in hemolyzed samples compared with plasma controls, such that olanzapine, and its internal standard olanzapine-d3, were virtually undetectable (Figure 6). An attempt to change the selectivity of the assay and adopt a more systematic extraction approach, by changing the bonded phase of the SPE sorbent to a mixed-mode cation exchange, was tried subsequently, again with the same phenomenon [5]. The combination method of PPT followed by mixed-mode cation exchange SPE, as previously described for carvedilol, was evaluated next. Under these conditions, both drug and internal standard were detectable, but analyte and internal standard responses were still 50% lower in hemolyzed samples compared with plasma controls. The observed suppression was matched in drug and internal standard and the concentrations found in plasma versus hemolyzed plasma were within 5% (Table 6). However, as the signal-to-noise in low concentration samples were considerably lower in hemolyzed samples, accuracy and precision of the method at the low end of the calibration curve was not considered comparable in plasma and hemolyzed samples. In addition, as hemolyzed samples had 50% lower internal standard responses they were consistently flagged as internal standard outliers, as were hemolyzed unknowns during study sample analysis. Accordingly, the extraction methodology was modified, to LLE. Using this approach, the impact from hemolyzed samples was completely eliminated and analyte responses for both drug and internal standard were consistent in plasma and hemolyzed plasma (Figure 7, Table 7).
The final validated assay involved extraction of olanzapine and the internal standard, olanzapine-d3, from 0.50 ml of human plasma, using potassium K2EDTA as the anticoagulant, by LLE into an organic medium, evaporated under nitrogen, reconstituted in 0.30 ml of mobile phase. An aliquot of this extract was injected into a HPLC system and detected using an EP10+ tandem mass spectrometer.
Practical tips
While assessment of hemolysis effect impact is being reported for LC–MS/MS-based assays [8], there is currently no standardized approach. From the work presented here, our recommendation is a simple approach using a spiked hemolyzed sample to ‘simulate’ a severely hemolyzed sample expected during the conduct of a clinical study. The following procedure is suggested as a practical approach:
▪ The effect of drug analysis in plasma in the presence of ruptured erythrocytes (red blood cells) is assessed;
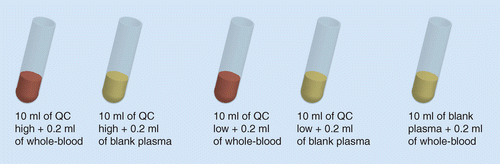
▪ Quality control (QC) samples at high and low analyte concentrations, with (hemolyzed) and without (nonhemolyzed) the presence of 2% hemolyzed blood, are analyzed, in replicates of six and compared along with a blank hemolyzed control sample for selectivity assessment (Figure 8);
▪ These samples are analyzed along with a duplicate standard curve and QC samples, including blank and blank with internal standard and analyte concentrations measured.
The acceptance criteria are:
▪ The concentration of analyte(s) in 2% hemolyzed samples must be within ±15% of the nonhemolyzed reference of the same concentration level for both QC high and QC low;
▪ A failed (2% hemolyzed samples) experiment may be repeated using a lesser degree of hemolysis sample (e.g., 1%). Only study samples with the same degree of hemolysis would yield reportable values;
▪ The blank control sample should be free of significant interference at the retention time of the analytes.
Future perspective
Understanding the need to assess the impact from matrix effects has been widely studied in routine bioanalysis using LC–MS/MS-based assays. Quantitative assessments of analytes spiked into a number of different individual matrix sources is a standard method validation parameter to ensure method quantitation consistency between matrix sources, as recommended in the 2001 guidance from the US FDA [9] and further emphasized after Crystal City III in 2006 [10]. Hemolysis effect is a special type of matrix effect. Hemolyzed samples, even as evidenced by their visible appearance, can differ dramatically from sample to sample depending on the degree of hemolysis, making them very heterogeneous. We have clearly demonstrated that the impact from hemolysis effect on a bioanalytical assay can range from a marginal impact to an effect that is significant, and the corresponding ion suppression is so marked that the analyte is not detectable at any given concentration. We have shown the approaches taken to resolve any impact from hemolysis effect can range from simple to complex methodologies to ensure accurate analyte quantitation in severely hemolyzed samples at any given concentration over the calibration range of an assay. In bioanalysis, this is essential to ensure universal application of the method to all samples to support preclinical and clinical PK trials.
| Analyte | Original method | Hemolysis effect assessment* | Method modification |
|---|---|---|---|
| Atorvastatin ▪ P-hydroxyatorvastatin ▪ O-hydroxyatorvastatin | LLE, LC–MS/MS | Interference peak in hemolyzed samples affected method accuracy | Mobile phase modified to separate interference |
| Phenylephrine | SPE, LC–MS/MS | No hemolysis effect in moderately hemolyzed plasma samples (1% hemolyzed whole-blood) | Internal standard changed from analog to a deuterated internal standard |
| Carvedilol ▪ O-desmethylcarvedilol 4-hydroxycarvedilol 5-hydroxycarvedilol | SPE, LC–MS/MS | Metabolites not quantifiable in hemolyzed samples | Extraction method changed to PPT/SPE combination |
| Olanazapine | SPE, LC–MS/MS | Analyte not detectable in hemolyzed samples | Extraction method modified to LLE |
| Original chromatographic conditions | Revised chromatographic conditions | ||||
|---|---|---|---|---|---|
| QC low | QC high | QC low | QC high | ||
| Amount added (ng/ml) | |||||
| 1.200 | 76.746 | 1.200 | 76.746 | ||
| Pooled human plasma | Amount found (ng/ml) | ||||
| n | 6 | 6 | 6 | 6 | |
| Mean | 1.610 | 72.644 | 1.141 | 74.830 | |
| SD | 0.045 | 1.832 | 0.029 | 1.367 | |
| CV (%) | 2.8 | 2.5 | 2.6 | 1.8 | |
| Human plasma containing hemolyzed whole-blood | Amount found (ng/ml) | ||||
| n | 6 | 6 | 6 | 6 | |
| Mean | 1.017 | 66.832 | 1.129 | 72.275 | |
| SD | 0.033 | 3.478 | 0.028 | 2.061 | |
| CV (%) | 3.3 | 5.2 | 2.4 | 2.9 | |
| Difference (%) | -36.8 | -8.0 | -1.1 | -3.4 | |
| Analog internal standard: plasma and 2% hemolyzed whole-blood | Analog internal standard: plasma and 1% hemolyzed whole-blood | Deuterated internal standard: plasma and 2% hemolyzed whole-blood | ||||||
|---|---|---|---|---|---|---|---|---|
| QC low | QC high | QC low | QC high | QC low | QC high | |||
| Amount added (ng/ml) | ||||||||
| 11.999 | 383.929 | 11.999 | 383.929 | 11.999 | 383.929 | |||
| Pooled human plasma | Amount found (ng/ml) | |||||||
| n | 6 | 6 | 6 | 6 | 6 | 6 | ||
| Mean | 11.811 | 363.652 | 11.047 | 371.098 | 11.922 | 367.297 | ||
| SD | 1.00 | 1.00 | 1.00 | 1.00 | 1.00 | 1.00 | ||
| CV (%) | 8.5 | 0.3 | 9.1 | 0.3 | 8.4 | 0.3 | ||
| Human plasma containing hemolyzed whole-blood | Amount found (ng/ml) | |||||||
| n | 6 | 6 | 6 | 6 | 6 | 6 | ||
| Mean | 9.773 | 308.181 | 11.340 | 364.425 | 12.094 | 356.646 | ||
| SD | 0.38 | 4.71 | 0.38 | 7.99 | 0.19 | 6.40 | ||
| CV (%) | 3.9 | 1.5 | 3.3 | 2.2 | 1.6 | 1.8 | ||
| Difference | -17.3 | -15.3 | 2.7 | -1.8 | 1.4 | -2.9 | ||
| Carvedilol | O-desmethyl carvedilol | 4-OH carvedilol | 5-OH carvedilol | ||||||||
|---|---|---|---|---|---|---|---|---|---|---|---|
| QC low | QC high | QC low | QC high | QC low | QC high | QC low | QC high | ||||
| Amount added (ng/ml) | |||||||||||
| 3.003 | 96.086 | 0.601 | 19.218 | 0.599 | 19.194 | 0.599 | 19.194 | ||||
| Pooled human plasma | Amount found (ng/ml) | ||||||||||
| n | 6 | 6 | 6 | 6 | 6 | 6 | 6 | 6 | |||
| Mean | 3.004 | 90.253 | 0.536 | 18.050 | 0.522 | 18.074 | 0.538 | 18.013 | |||
| SD | 0.32 | 3.07 | 0.07 | 0.92 | 0.05 | 0.48 | 0.05 | 0.52 | |||
| CV (%) | 10.7 | 3.4 | 12.7 | 5.1 | 9.6 | 2.6 | 9.9 | 2.9 | |||
| Human plasma containing hemolyzed whole-blood | Amount found (ng/ml) | ||||||||||
| n | 6 | 6 | 6 | 6 | 6 | 6 | 6 | 6 | |||
| Mean | 2.895 | 95.580 | 0.426 | 15.483 | 0.000 | 0.284 | 0.000 | 0.037 | |||
| SD | 0.10 | 3.64 | 0.02 | 0.25 | 0.00 | 0.15 | 0.00 | 0.06 | |||
| CV (%) | 3.5 | 3.8 | 3.7 | 1.6 | 52.2 | 154.9 | |||||
| Difference | -3.6 | 5.9 | -20.4 | -14.2 | -100.0 | -98.4 | -100.0 | -99.8 | |||
| Carvedilol | O-desmethyl carvedilol | 4-OH carvedilol | 5-OH carvedilol | ||||||||
|---|---|---|---|---|---|---|---|---|---|---|---|
| QC low | QC high | QC low | QC high | QC low | QC high | QC low | QC high | ||||
| Amount added (ng/ml) | |||||||||||
| 3.003 | 96.086 | 96.086 | 19.218 | 0.599 | 19.184 | 0.599 | 19.184 | ||||
| Pooled human plasma | Amount found (ng/ml) | ||||||||||
| n | 6 | 6 | 6 | 6 | 6 | 6 | 6 | 6 | |||
| Mean | 3.523 | 105.542 | 0.662 | 20.130 | 0.652 | 20.391 | 0.669 | 19.800 | |||
| SD | 0.06 | 0.59 | 0.03 | 0.23 | 0.03 | 0.23 | 0.03 | 0.19 | |||
| CV (%) | 1.6 | 0.6 | 4.1 | 1.2 | 4.9 | 1.1 | 4.1 | 1.0 | |||
| Human plasma containing hemolyzed whole-blood | Amount found (ng/ml) | ||||||||||
| n | 6 | 6 | 6 | 6 | 6 | 6 | 6 | 6 | |||
| Mean | 3.781 | 107.067 | 0.716 | 21.053 | 0.661 | 20.209 | 0.659 | 19.223 | |||
| SD | 0.04 | 1.48 | 0.02 | 0.22 | 0.01 | 0.21 | 0.02 | 0.25 | |||
| CV (%) | 0.012 | 0.014 | 0.030 | 0.010 | 0.021 | 0.011 | 0.026 | 0.013 | |||
| Difference | 7.3 | 1.4 | 8.2 | 4.6 | 1.3 | -0.9 | -1.4 | -2.9 | |||
| Olanzapine (peak area) | Olanzapine-d3 (peak area) | Concentration (ng/ml) | |
|---|---|---|---|
| Pooled human plasma | |||
| n | 4 | 4 | 4 |
| Mean | 3184 | 558555 | 0.215 |
| SD | 247 | 34141 | 0.02 |
| CV (%) | 7.8 | 6.1 | 7.5 |
| Human plasma containing 2% hemolyzed whole-blood | |||
| n | 4 | 4 | 4 |
| Mean | 1557 | 262569 | 0.206 |
| SD | 119 | 7087 | 0.01 |
| CV (%) | 7.6 | 2.7 | 4.7 |
| Difference (%) | 51 | 53 | 4.0 |
| QC low | QC high | |
|---|---|---|
| Plasma vs plasma containing 2% hemolyzed whole-blood: amount added (ng/ml) | 0.600 | 19.193 |
| Pooled human plasma: amount found (ng/ml) | 0.164 0.587 0.586 0.589 0.597 0.614 | 18.796 19.409 19.268 19.427 19.576 19.546 |
| Mean | 0.599 | 19.337 |
| Human plasma containing hemolyzed whole-blood: amount found (ng/ml) | 0.597 0.595 0.592 0.600 0.592 0.612 | 18.813 19.137 18.966 18.968 19.160 19.201 |
| Mean | 0.598 | 19.041 |
| Difference | -0.2 | -1.5 |
Liquid Chromatography
Powerful technique used for the separation of complex mixtures. It relies on the differential affinities of an analyte for a mobile phase and a stationary phase. Chromatographic separation is carried out after extraction and before MS/MS detection
Matrix effect
The impact of ion suppression/enhancement, from endogenous matrix components, on analyte quantitation
Accuracy
Closeness of mean test results obtained by the method to the true concentration of the analyte
Precision
Closeness of individual measurements of an analyte when the method is applied repeatedly to multiple aliquots of a single homogenous volume of biological matrix
Hemolysis
Process that occurs during or after blood collection, in which lysis of red blood cells results in a pink to red discoloration of the plasma
Hemolysis effect
Impact of the presence of the contents of lysed red blood cells in matrix on analyte quantitation
Extraction
The act of ‚taking out’ or separating the analyte of interest from a complex matrix, such as plasma. Commonly used extraction techniques include protein precipitation, SPE and LLE. Extraction of an analyte from matrix is carried out before LC–MS/MS analysis
Executive summary
▪ Assessing matrix effects for LC–MS-based assays is a regulatory requirement to ensure a method yields accurate and consistent results in matrices from different donors.
▪ A small percentage of hemolyzed samples are unavoidable during blood sampling for a pharmacokinetic study (clinical and preclinical).
▪ Hemolysis effect is a special type of matrix effect that can impact the performance of an assay.
▪ Rejection of hemolyzed samples is not encouraged for a clinical/preclinical study.
▪ Elimination of hemolysis effect may require application of variety of analytical approaches. Four examples of approaches used in our laboratory are presented.
▪ Demonstration that a method has no impact from hemolysis effect ensures it can be applied to both plasma and hemolyzed plasma samples for a given study and yield accurate and reliable results.
Financial & competing interests disclosure
The authors have no relevant affiliations or financial involvement with any organization or entity with a financial interest in or financial conflict with the subject matter or materials discussed in the manuscript. This includes employment, consultancies, honoraria, stock ownership or options, expert testimony, grants or patents received or pending, or royalties.
No writing assistance was utilized in the production of this manuscript.
Papers of special note have been highlighted as: ▪ of interest ▪▪ of considerable interest
Bibliography
- 1 Kebarle P, Tang L. From ions in solution to ions in the gas phase – the mechanism of electrospray mass-spectrometry. Anal. Chem.65,A972–A986 (1993).▪ Describes the mechanism of matrix effects.
- 2 Matuszewski BK, Constanzer ML, Chavez-Eng CM. Matrix effect in quantitative LC/MS/MS analyses of biological fluids: a method for determination of finasteride in human plasma at picogram per milliliter concentrations. Anal Chem.70(5),882–889 (1998).
- 3 Pascoe R, Foley JP, Gusev AI. Reduction in matrix-related signal suppression effects in electrospray ionization mass spectrometry using on-line two-dimensional liquid chromatography. Anal Chem.73(24),6014–6023 (2001).
- 4 Müller C, Schäfer P, Störtzel M, Vogt S, Weinmann W. Ion suppression effects in liquid chromatography–electrospray-ionisation transport-region collision induced dissociation mass spectrometry with different serum extraction methods for systematic toxicological analysis with mass spectra libraries. J. Chromatogr. B. Analyt. Technol. Biomed. Life Sci.773(1),47–52 (2002).
- 5 Chambers E, Wagrowski-Diehl DM, Lu Z, Mazzeo JR. Systematic and comprehensive strategy for reducing matrix effects in LC/MS/MS analyses. J. Chromatogr. B. Analyt. Technol. Biomed. Life Sci.852(1–2),22–34 (2007).▪ Good strategy for the systematic development of SPE methods.
- 6 Kang J, Hick LA, Price W. Using calibration approaches to compensate for remaining matrix effects in quantitative liquid chromatography/electrospray ionization multistage mass spectrometric analysis of phytoestrogens in aqueous environmental samples. Rapid Commun. Mass Spectrom.21(24),4065–4072 (2007).
- 7 Dams R, Huestis MA, Lambert WE, Murphy CM. Matrix effect in bio-analysis of illicit drugs with LC–MS/MS: influence of ionization type, sample preparation, and biofluid. J. Am. Soc. Mass Spectrom.14(11),1290–1294 (2003).
- 8 Huynh NH, Tyrefors N, Ekman L, Johansson M. Determination of fentanyl in human plasma and fentanyl and norfentanyl in human urine using LC–MS/MS. J. Pharm. Biomed. Anal.37(5),1095–1100 (2005).▪▪ Provides an example of validation of the hemolysis effect.
- 9 US FDA. Guidance for Industry: Bioanalytical Method Validation. US Department of Health and Human Services, FDA, Center for Drug Evaluation and Research, Rockville, MD, USA (2001).▪▪ Details of method-validation process.
- 10 Viswanathan CT, Bansal S, Booth B et al. Workshop/conference report – quantitative bioanalytical methods validation and implementation: best practices for chromatographic and ligand binding assays. Am. Assoc. Pharm. Sci. J.9(1),E30–E42 (2007).▪▪ Conference report highlighting recommended changes to improve the method-validation process.
- 11 Laga A, Cheves T, Maroto S, Coutts M, Sweeney J. The suitability of hemolyzed specimens for compatibility testing using automated technology. Transfusion48(8),1713–1720 (2008).▪▪ Discusses hemolysis effect, what causes it and how to minimize it.


