


Method for detection and identification of multiple chromosomal integration sites in transgenic animals created with lentivirus
Abstract
Transgene delivery systems, particularly those involving retroviruses, often result in the integration of multiple copies of the transgene throughout the host genome. Since site-specific silencing of trangenes can occur, it becomes important to identify the number and chromosomal location of the multiple copies of the transgenes in order to correlate inheritance of the transgene at a particular chromosomal site with a specific and robust phenotype. Using a technique that combines restriction endonuclease digest and several rounds of PCR amplification followed by nucleotide sequencing, it is possible to identify multiple chromosomal integration sites in transgenic founder animals. By designing genotyping assays to detect each individual integration site in the offspring of these founders, the inheritance of transgenes integrated at specific chromosomal locations can be followed efficiently as the transgenes randomly segregate in subsequent generations. Phenotypic characteristics can then be correlated with inheritance of a transgene integrated at a particular chromosomal location to allow rational selection of breeding animals in order to establish the transgenic line.
Introduction
Production of genetically engineered animals by pronuclear injection or retroviral delivery systems has been a successful strategy for generating animal models to better understand the functionality of genes. In transgenic animals created by embryo microinjection, the site of integration of the transgene within the genome is a random event. Thus, when multiple embryos have been injected or infected with the same DNA, the integration site will be different in each founder animal. When the integration events have occurred at the one-cell stage, they should exhibit germline transmission with the potential to be inherited by the founder's offspring. If the integration occurs at a later stage, the resulting mosaic founder may or may not exhibit germline transmission of the transgene. In the case of pronuclear injection, there is typically one insertion site, although multiple transgene copies are often found in a tandem array at that integration site (1).
Lentivirus transgenesis is becoming an increasingly attractive alternative to pronuclear injection because it is more efficient in terms of successful transgene incorporation into the host genome, less invasive to the embryo, and technically less demanding to perform (2). Lentiviral delivery systems have been used successfully to generate transgenic mice, rats, pigs, and cattle (2–7). The disadvantage of lentivirus is that there are often multiple integration events with random transgene insertions on several chromosomes.
Independent of the method of transgene delivery, the insertion site can have profound effects on transgene expression. This can lead to phenotypic effects in the transgenic animal that are not due to the transgene per se, but are a consequence of the integration site, a phenomenon referred to as position effect (8). It is critical to correlate phenotype with genotype, particularly in animals created via lentivirus transgenesis, since not all copies of the transgene may be contributing equally to the phenotype.
Determining transgene integration sites is challenging. A number of PCR-based methods, often referred to as chromosome walking techniques, have been developed to isolate DNA fragments adjacent to known sequences, including inverse PCR (9), ligation-mediated PCR (LMPCR) (10), randomly primed PCR (RP-PCR) (11,12), and T-linker PCR (13). The method described in this paper incorporates several elements of these techniques in a unique way that allows the capture of DNA fragments containing the chromosomal region flanking the transgene. Our method enables quick and inexpensive determination of multiple independent transgene integration sites in founder animals and their offspring. Here, we demonstrate that this method is useful for identifying and monitoring multiple transgene integration sites in transgenic animals created using lentivirus.
Materials and methods
Animals
Lewis rat lines carrying an enhanced green fluorescent protein (EGFP) transgene were created by using the EGFP DNA construct and experimental protocol described by Lois et al. (2). Transgene positive founder animals were identified using an EGFP PCR assay (14). To assess GFP expression, tail biopsies were examined for fluorescence under a Nikon SMZ1500 UV dissecting scope (Nikon Instruments, Melville, NY, USA). Founders (F0) were bred to wild-type Lewis rats obtained from Harlan Sprague Dawley (Indianapolis, IN, USA) to generate the N1. N1 animals were genotyped using integration site-specific PCR assays. Selected N1 animals were mated to wild-type Lewis rats to generate the N2. N2 animals were genotyped using integration site-specific genotyping assays, and GFP expression was confirmed. Several of these lines (F455.5, F456.9, F458.7, F463.1, and F463.5) demonstrated stable transmission of the integration site-specific transgene coupled with robust GFP expression and were donated to the Rat Research and Resource Center (RRRC) at the University of Missouri. All other rat lines and mouse strains used are available either through the RRRC (www.nrrrc.missouri.edu) for rats or the University of Missouri/Harlan Mutant Mouse Regional Resource Center (MMMRC; www.mmrrc.org) for mice.
Preparation of DNA
DNA was isolated from tail biopsies using the DNeasy® Tissue kit (Qiagen, Valencia, CA, USA). Restriction endonuclease digestion was performed with PstI and HhaI (Figure 1, step 1). These enzymes were chosen because they created 3′ overhangs and their recognition sites were not present within the transgene sequence. Three micrograms genomic DNA were digested with 20 U enzyme in a total reaction volume of 30 µL as recommended by the manufacturer. Reactions were incubated for 2 h for partial digestion.
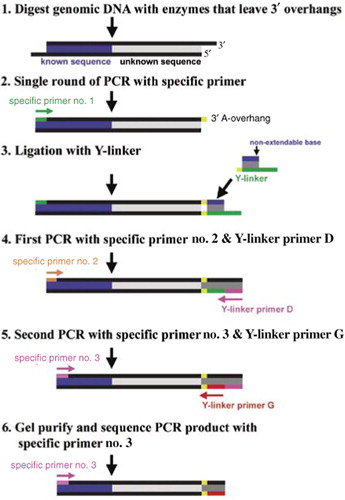
Known sequence derived from the transgene is shown in blue, while unknown sequence representing the insertion site is shown in gray. 5′ to 3′ orientation is indicated, and for simplicity, only identification of the portion of the integration site on the 3′ end of the transgene is depicted. The same process is performed to identify the integration site sequence flanking the 5′ end of the transgene. After digestion with a restriction enzyme that generates 3′ overhangs (step 1), a single round of PCR using transgene-specific primer no. 1 (green) is performed (step 2). The amplification product will have a 3′ A-overhang (yellow). In step 3, a Y-linker is prepared and ligated to the amplification product from step 2. In step 4, this ligated product is amplified by PCR using transgene-specific primer no. 2 (orange) and Y-linker primer D (pink). The resulting amplification product is reamplified by PCR (step 5) using transgene-specific primer no. 3 (pink) and Y-linker primer G (red). The resulting amplification products which are defined by the sequences corresponding to transgene-specific primer no. 3 on the 5′ end and Y-linker primer G on the 3′ end are separated by gel electrophoresis, gel purified, and analyzed by nucleotide sequence analysis using transgene-specific primer no. 3 (pink) as the sequencing primer.
PCR Amplification and Linker Ligation
Three transgene-specific nested primers were designed to both the 5′ and 3′ regions of the transgene using PrimerQuest available from Integrated DNA Technologies (IDT; Coralville, IA, USA). Primer 1 was farthest from the junction between the known transgene sequence and the unknown integration site, whereas primer 3 was closest (Figure 1). All gene-specific primers were designed to have an optimum melting temperature (Tm) of 60°C, optimum primer length of 24 bp, and an optimum% GC content of 50. Y-linker and primer sequences for the Y-linker and their relationships are provided in Figure 2. Y-linker A (Figure 2) contains a terminal inverted T at the 3′ end to inhibit extension by DNA polymerases. The Y-linker was prepared by combining equal volumes of 8 µM Y-linker A and 8 µM Y-linker E, incubating at 95°C for 5 min, and then letting the reaction cool on the benchtop. The sequences of the genespecific primers used for the lentivirus-generated rat lines are available upon request or are listed under the genotyping assay for the specific lines at www.nrrrc.missouri.edu. Primers and linkers were synthesized by IDT.

Y-linker A (blue) contains a nonextendable base (3InvdT) and, when annealed to Y-linker E (green), forms the complete Y-linker that is partially doublestranded. This linker has a single-stranded region (green bold) to which Y-linker primer D (pink) is designed. There is a single T (underlined) at the 3′ end of the Y-linker E sequence, which is included to facilitate pairing with the 3′ A-overhang on the PCR product generated using specific gene primer 1 (see Figure 1, step 2). Y-linker primer G (red) is used in the final round of PCR amplification. The orientation of each sequence (5′ or 3′) is indicated to the left.
All PCRs were performed in a 25-µL volume containing 2.5 µL 10× FastStart Taq with 20 mM MgCl2 (Roche Diagnostics, Indianapolis, IN, USA), 0.2 mM each dNTP, 1.6 µM each primer, and 1.25 U FastStart Taq buffer. In the first PCR, 1 µL restriction digest from above and transgenespecific primer 1 were used, and a single round of PCR was performed with the following thermal cycling conditions: 94°C for 10 min, 60°C for 1 min, and 72°C for 10 min (Figure 1, step 2). Following amplification, a 10-µL reaction containing 7 µL this PCR, 1 µM Y-linker, 400 U T4 DNA Ligase (New England BioLabs, Ipswich, MA, USA), and 1 µL 10× T4 DNA Ligase buffer supplied with the enzyme was incubated at 16°C for 16 h (Figure 1, step 3). Transgene-specific primer 2, Y-primer D, and 1 µL ligase reaction were used in the second PCR with the following cycling conditions: 94°C for 5 min, 20 cycles of 94°C for 30 s, 60°C for 30 s, 72°C for 1.5 min, and one cycle of 72°C for 10 min (Figure 1, step 4). The same cycling conditions were used in the third PCR. This final reaction utilized transgene-specific primer 3, Y-primer G, and 1 µL from the second PCR (Figure 1, step 5).
PCR Product Purification and Analysis
Amplification products from the third PCR were separated by gel electrophoresis on 1%-3% agarose gels, and individual products were gel-purified using QIAquick® Gel Extraction kit (Qiagen). When multiple bands were detected, all bands were isolated. The nucleotide sequence of each amplification product was determined using the transgene-specific primer 3 as a sequencing primer (Figure 1, step 6). Nucleotide sequencing was performed either at our DNA Core (University of Missouri-Columbia) or by SeqWright (Houston, TX, USA). The nucleotide sequences were aligned and examined to confirm the presence of the expected known transgene sequence and determine the flanking sequence representing the insertion site. The insertion site sequence was analyzed using Basic Local Alignment Search Tool (BLAST) (15) to determine the chromosomal location of the transgene.
Results and discussion
Lentivirus was used as a delivery system to create Lewis rat lines carrying an EGFP transgene (2). A total of nine transgene positive founder (F0) animals were recovered. While all nine founders were positive for the presence of the EGFP transgene, eight founders expressed EGFP based on epifluorescent microscopy of tail biopsies, while one founder (456) had no detectable fluorescence (Table 1). Our method for determining chromosomal integration sites was used to identify the chromosomal location(s) of the transgene in each of the nine founders. PCR products ranged in size from 100–1000 bp. Longer PCR fragments were generally necessary for determining the insertion site when the region contained repetitive elements. Several sites were successfully identified with recovered products as small as 110 bp, which included as little as 20 bp genomic sequence. For seven of the founders, we identified one to four integration sites depending on the founder. We failed to identify the integration site in two founders using PstI and HhaI digestion, and we did not pursue these further. It is possible that by using other restriction enzymes with 4–6 bp recognition sites or increasing PCR extension times to generate larger products, we would have successfully identified the integration sites in these founder lines. For seven lines, site-specific genotyping assays were developed for every integration site identified in the founder. In one case (463), we recovered genomic sequence that matched a sequence found on many chromosomes, so we could not assign a chromosomal location to this integration site. Nonetheless, the genotyping assay based on this sequence allowed the transgene integration site to be followed not only in the founder but in his offspring.
 |
To follow segregation of the integration sites, the offspring from matings between each of the seven founders and wild-type Lewis rats were monitored for presence and expression of the transgene at each integration site using the site-specific genotyping assays and microscopic examination for GFP fluorescence. One founder (452) was infertile. For the remaining six founder lines, offspring were obtained, and both the insertion sites and the GFP expression were determined.
Founder 455 had two independent transgene insertion sites: one on chromosome 1, and a second on chromosome 5. When this founder was mated to a wild-type Lewis animal, two N1 offspring were recovered. One N1 carried the chromosome 1 integration site, but did not have detectable GFP expression. Lack of expression may have been due to positional effects. The other N1 carried the chromosome 5 integration site and did have GFP expression. The chromosome 5 transgene positive N2 offspring (n = 5) continued to have high fluorescence, demonstrating that GFP expression in this line was associated with the chromosome 5 transgene, and could be stably transmitted from generation to generation. This illustrates the importance of determining which transgene insertion site was correlated with GFP expression in order to successfully maintain a GFP-expressing line.
Line 456, which carried two transgene insertion sites, was unusual in that the founder did not display GFP fluorescence. Of the offspring recovered from this founder, three carried the chromosome 17 transgene insertion only and one carried the chromosome 9 transgene insertion only. While animals carrying the chromosome 17 insertion did not have detectable fluorescence, robust GFP fluorescence was seen in the animal that inherited the chromosome 9 transgene insertion. The chromosome 9 transgene positive N2 animals continued to have high fluorescence, demonstrating that GFP expression in this line was associated with the chromosome 9 transgene. We speculate that GFP expression was suppressed at the chromosome 17 insertion due to a position effect and that the founder was mosaic for the chromosome 9 insertion, resulting in undetectable GFP expression. In subsequent generations, inheritance of the chromosome 9 insertion was germline, and expression occurred in all cells leading to detectable fluorescence.
For line 458, three insertion sites were detected. By correlating GFP expression with inheritance of the various transgene insertion sites, it was possible to show that the chromosome 7 integration gave good GFP expression. This was confirmed in N2 animals (n = 10) carrying only the chromosome 7 integration. It should be noted that while none of the N1 animals carried the chromosome 10 integration site, this site was confirmed in the original founder by integration site-specific genotyping. It is possible that the founder was mosaic for the chromosome 10 integration site.
For line 459, which had a single detected transgene insertion on chromosome 2, two offspring were recovered that inherited the chromosome 2 transgene insertion site. However, neither of these animals exhibited GFP fluorescence. This could be due to a positional effect associated with the particular insertion site on chromosome 2 coupled with inheritance through the male lineage, or alternatively, we may have missed an insertion site in founder 459 that was associated with the fluorescence seen in the founder, which was not inherited by these two offspring.
Founder 463 had the greatest number of insertion sites; by continuing to correlate GFP expression with inheritance of specific transgene insertion sites, it was possible by the N2 generation to identify animals with single transgene insertion sites that maintained high GFP expression.
In addition to the lentivirus experiment described above, we have successfully used this technique to determine the lentivirus integration sites and to generate rat lines with single transgene integration sites for a Sprague-Dawley GFP transgenic (RRRC: 0065), derived from the line created by Lois et al. (2), and a rat model containing the human presenilin-1 gene (RRRC: 0061). To test whether our method for identifying insertion sites had broader application beyond just determining chromosomal locations of lentivirus transgene integration, we attempted to identify the transgene integration site of three additional rodent strains: (i) a mouse transgenic strain (MMRRC: 000366-MU/H) carrying the EGFP gene on the FVB inbred genetic background (16); (ii) a knockout mouse line (MMRRC: 000352-MU/H) involving the acetylcoenzyme A dehydrogenase long chain gene (Acadl), which carries a duplication of exons 3 and 4 with insertion of the neocassette into the approximately 11 kb intron 4 (17); and (iii) a transgenic rat line (RRRC: 0043), which contains a mutated version of the human HLA-B2705 gene on a Lewis genetic background (18). In the case of the FVB-EGFP strain and the Acadl knockout strain, we were able to determine precisely the insertion site on chromosome 3 and within the large Acadl intron 4, respectively. Our method failed for the HLA-B2705 transgenic rat line, which has a high transgene copy number (24 copies) in homozygous animals (18). The insertions are integrated at a single locus (18), and the multiple copies have probably integrated as concatamers.
A major advantage of determining the precise chromosomal integration site in animals created via pronuclear injection is that genotyping assays can be developed that allow animals heterozygous for a transgene to be easily distinguished from homozygous animals. Without this type of information, PCR-based genotyping assays can distinguish only whether animals carry the transgene. While it is possible to use Southern blot analysis and densitometry to measure transgene copy number as an alternative method to distinguish homozygotes from heterozygotes, it is laborious, timeconsuming, and not practical for many labs.
In summary, we have described a quick and straightforward method for determining the location of multiple chromosomal integration sites in animals created by lentivirus transgenesis. Our studies underline the need to carefully correlate a particular integration site with gene expression over multiple generations in order to create stable models. We have also found that this method has applicability for detecting transgene integration sites in other cases of random integration, but is probably limited to situations where very few tandem copies of the transgene have been integrated at the insertion site.
Acknowledgments
E.C.B. and M.P contributed equally to this work. This work was supported in part by grants from the National Institutes of Health (NIH; U42 RR014821 and P40 RR16939). We thank James Sparks for technical assistance and Howard Wilson for assistance with graphics.
Competing Interests Statement
The authors declare no competing interests.
References
- 1. . 1987. Tracking of mouse cell lineage using microinjected DNA sequences: analyses using genomic Southern blotting and tissue-section in situ hybridizations. Differentiation 35:37–44.
- 2. . 2002. Germline transmission and tissue-specific expression of transgenes delivered by lentiviral vectors. Science 295:868–872.
- 3. . 2003. Efficient transgenesis in farm animals by lentiviral vectors. EMBO Rep. 4:1054–1060.
- 4. . 2004. Efficient generation of transgenic pigs using equine infectious anaemia virus (EIAV) derived vector. FEBS Lett. 571:233–236.
- 5. . 2002. Transgenesis by lentiviral vectors: lack of gene silencing in mammalian embryonic stem cells and preimplantation embryos. Proc. Natl. Acad. Sci. USA 99:2140–2145.
- 6. . 2004. Generation of transgenic cattle by lentiviral gene transfer into oocytes. Biol. Reprod. 71:405–409.
- 7. . 2004. Lentivirally generated eGFP-transgenic rats allow efficient cell tracking in vivo. Genesis 39:94–99.
- 8. . 1994. Chromosomal position effects and the modulation of transgene expression. Reprod. Fertil. Dev. 6:589–598.
- 9. 1992. PCR amplification techniques for chromosome walking. Trends Biotechnol. 10:44–48.
- 10. . 1990. Genomic walking and sequencing by oligocassette mediated polymerase chain reaction. Nucleic Acids Res. 18:3095–3096.
- 11. . 1989. Genome walking by single-specific-primer polymerase chain reaction: SSP-PCR. Gene 84:1–8.
- 12. . 1991. Targeted gene walking polymerase chain reaction. Nucleic Acids Res. 19:3055–3060.
- 13. . 2003. Tlinker-specific ligation PCR (T-linker PCR): an advanced PCR technique for chromosome walking or for isolation of tagged DNA ends. Nucleic Acids Res. 31:e68.
- 14. . 2002. Transgenic pig expressing the enhanced green fluorescent protein produced by nuclear transfer using colchicine-treated fibroblasts as donor cells. Mol. Reprod. Dev. 62:300–306.
- 15. . 1990. Basic local alignment search tool. J. Mol. Biol. 215:403–410.
- 16. . 1999. Ubiquitous expression of marker transgenes in mice and rats. Dev. Biol. 214:128–138.
- 17. . 1998. Targeted disruption of mouse long-chain acyl-CoA dehydrogenase gene reveals crucial roles for fatty acid oxidation. Proc. Natl. Acad. Sci. USA 95:15592–15597.
- 18. . 1999. Inflammatory disease in HLA-B27 transgenic rats. Immunol. Rev. 169:209–223.


